Branding
This is logo I created for iCORDS, which stands for: Intergrated Continent-Ocean Research Data System The sphere represents land-oceanic oil and shale research. The font color represents oil/shale. The geologists loved it!
This is iCORDS logo which stands for: International Continent-Ocean Research and Development System. The sphere represents land-oceanic oil and shale research.
iCORDS had a shell for a platform. I had to come in with a plan to make it user friendly and easier to navigate. At the same time, give it a clean, spacial feel. I led the design of the platform for geoscientist that will be used globally across modern browsers. I also doubled as an art director and branded everything from the start of this adventure. Since my time with iCORDS, I have designed the launch of version 1.0, 1.1, and started the design of version 2.
This is logo I created for iCORDS, which stands for: Intergrated Continent-Ocean Research Data System The sphere represents land-oceanic oil and shale research. The font color represents oil/shale. The geologists loved it!
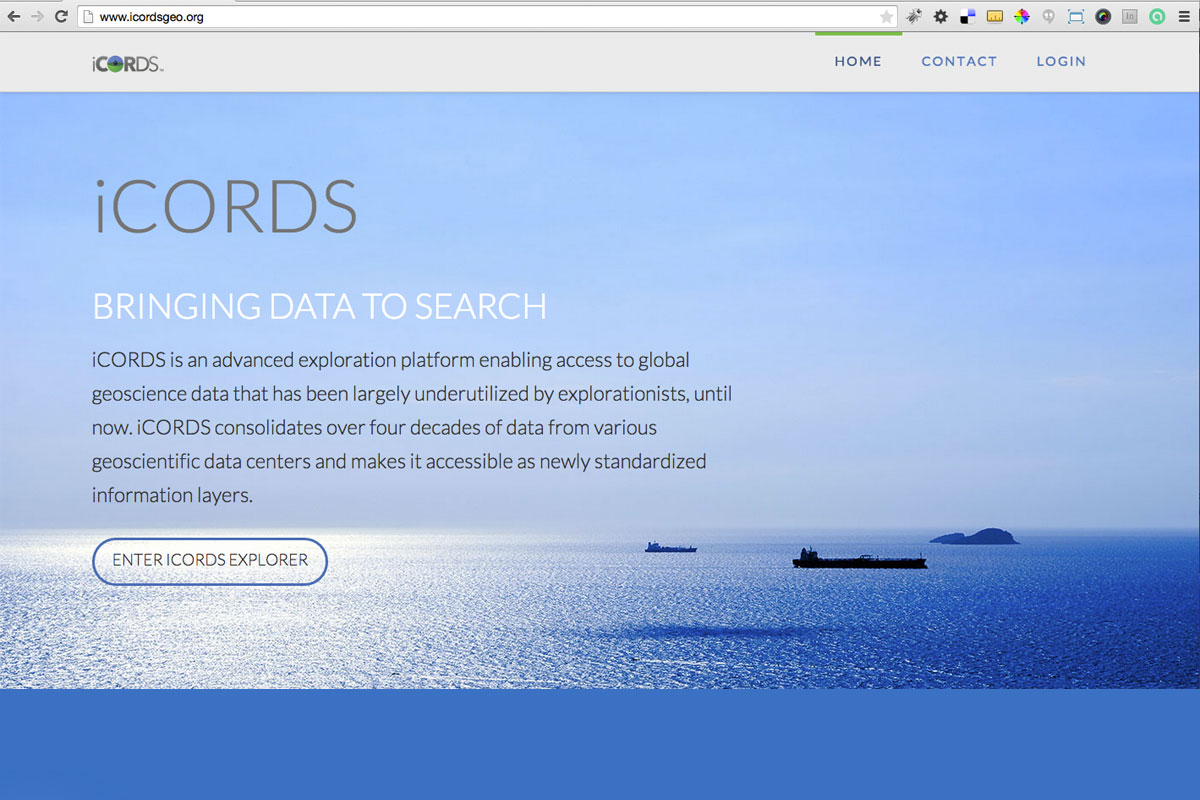
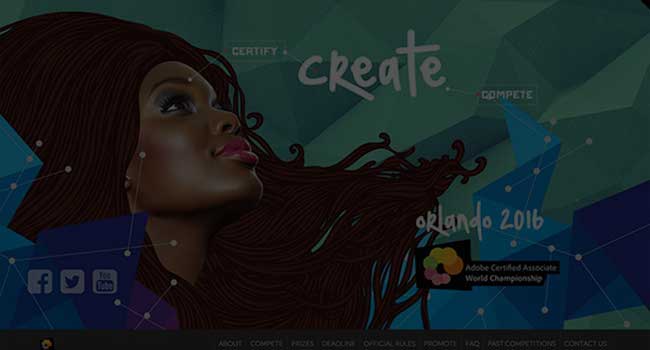
This is iCORDS landing page for the public to view. We created this using Wordpress so content can be updated with ease by marketing. Well that's what they all say, easy until they try it, then we'll receive a call for help - which we love, we care so much for our clients.
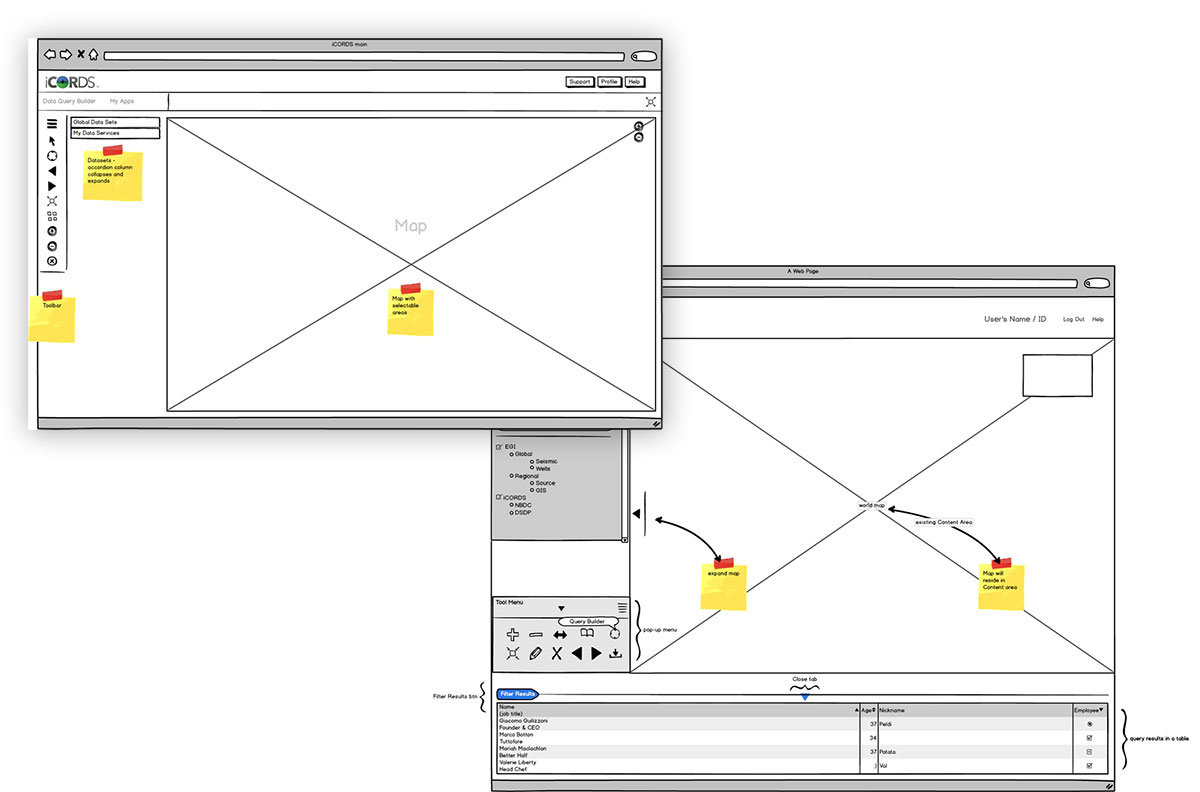
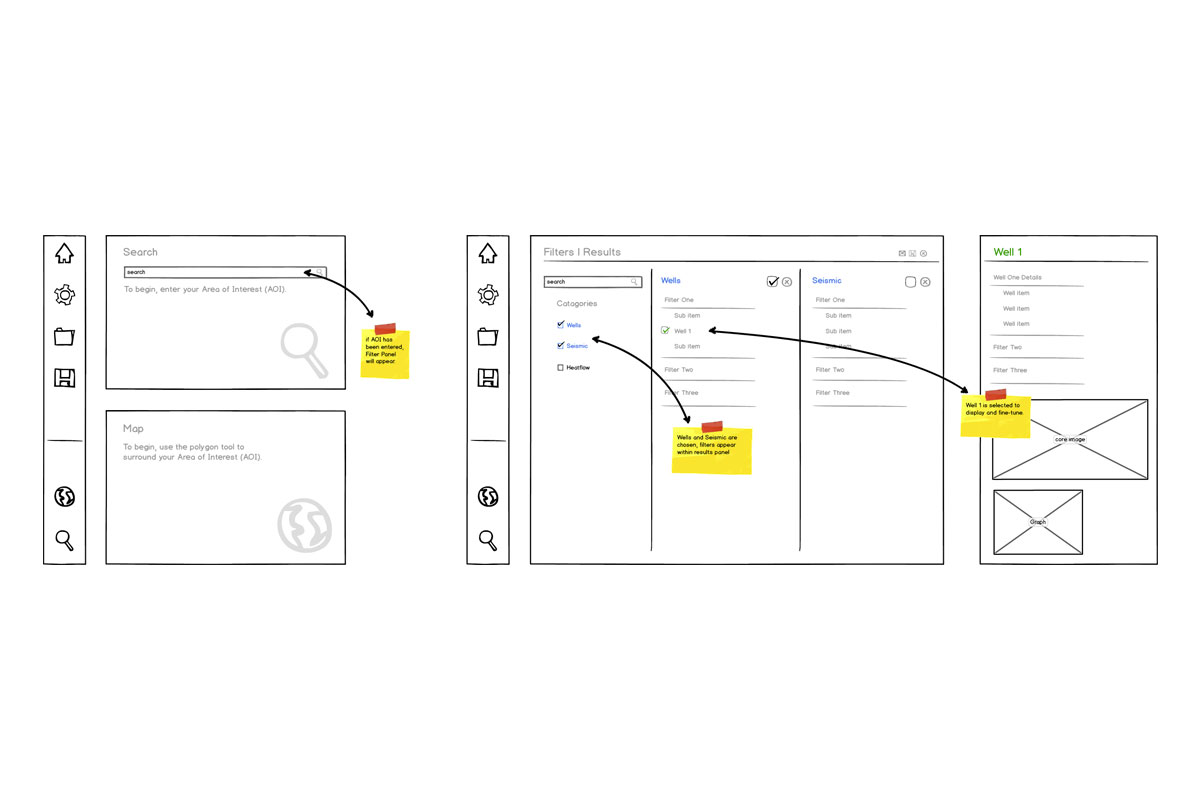
This wireframe was a simplified take on the original beta version. The idea was to get the most information geologists or researchers would need from the dashboard itself.
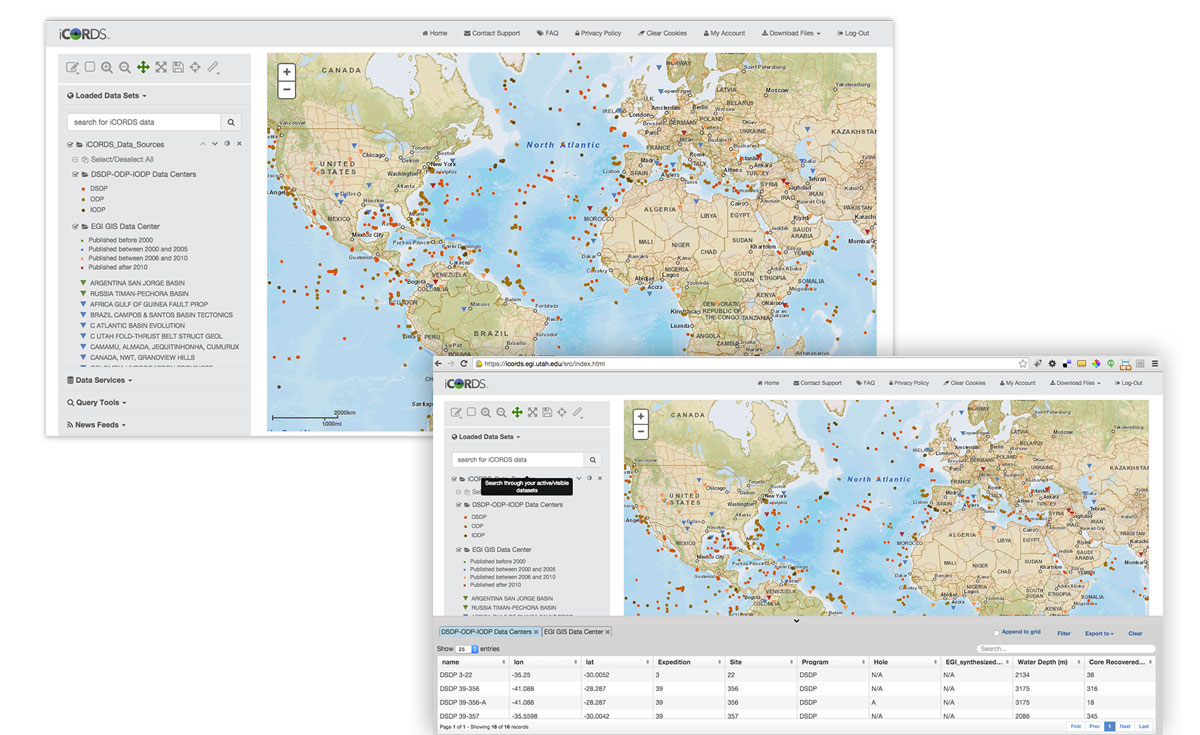
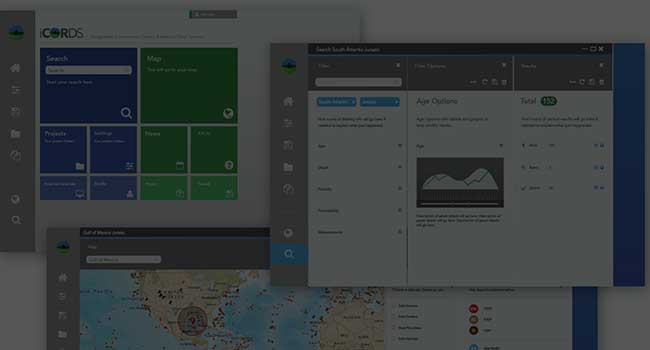
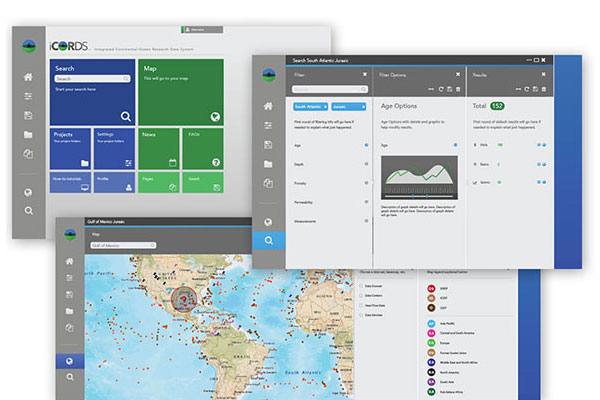
From wireframes to mock-ups to production. Subscribers are working with this version at this moment. We gather information from them everyday through support and surveys. User Experience at it's best, straight from the source. This goes straight to our design/dev team to update and solve any problems that occur.
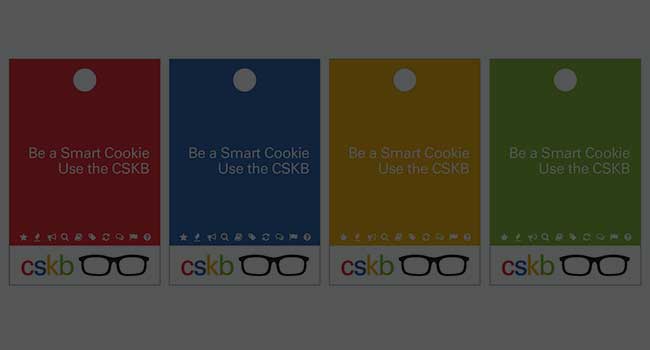
With version 1 out and keeping up with maintenance and updates. We are already working on the next best thing. I can't go into much as far as details, but i'm guessing you can spot the trend we are heading towards.
Excited to be working on the next version. Again, can't go into details, but it will be a geologist dream come true. A time saver, plus finding data from one platform rather than multiple.
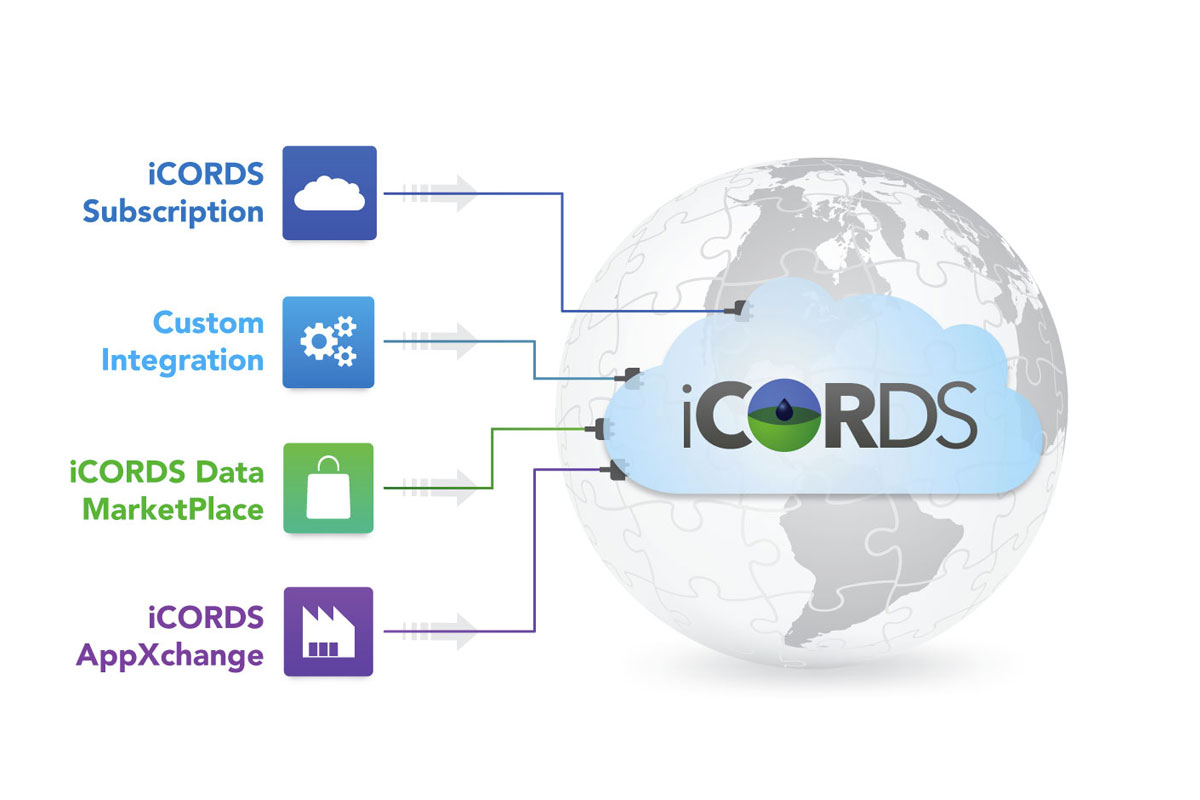
This quickly shows the time-saving, abundant resources, and end results when using this platform. We like pictures. Creating all our informative graphics in Illustrator, we can resize them to whatever we'd like.